
Presenting statistic results of an AI-based customer footfall, track and trace calculator.
GIGABYTE, TAIPEI TAIWAN, 2020
The challenge of this project was to become statistic savvy within a limited time. I carefully studied the data types we can collect from the image recognition system and found a proper method to present them.

By consulting our sales representatives, I learned how to view information from the business point of view like a shop owner. Interviews and workshops with our algorithm developers have taught me about different data types, the image recognition abstract and trace track.Besides competitor analysis, I also study non-related products to expand my view of data visualisation.
According to the interview, users from different industries expect different types of insight. Hence developed a dynamic system for the column of the chart: 3 different sizes for every kind of chart display. Users can enlarge the statistic result they value the most and use the limited space for the most effective.
The final delivery includes a data visualisation style guide, UI component and a complete hi-fi prototype. Before finalising the design, I conducted a usability test with 20 participants to ensure a smooth user experience.


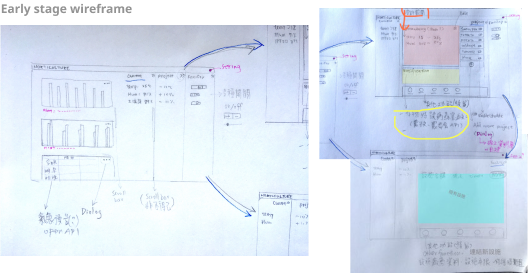
Sketches & Ideation Process
Technical Plan
Usability Test
User Interview
User Journey
Wireframes & Mockups