This is a UX redesign project for a website I frequently use. After analysing the user journey, I promised the interface with a more compressed layout and simplified the process for business owners ordering products online.
Side project, 2021
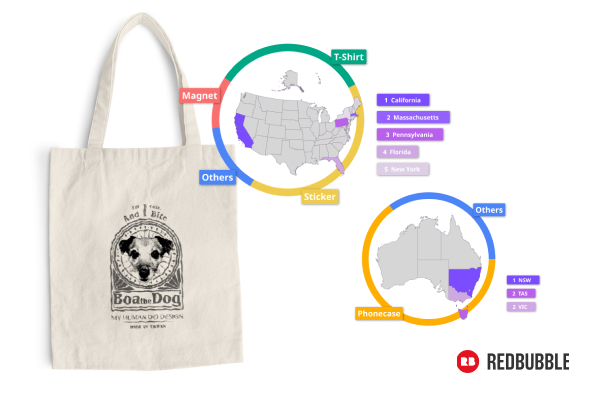
Redbubble is an online marketplace for print-on-demand products, and I have been selling sell my graphic artwork on it for 3-4 years. There are more than 100 products available on the website. I wish to know the most popular items for my artworks and where my clients are primarily from among these massive possibilities.

The main markets of Redbubble are the U.S., European regions and Australia. I highlight the country with the top turnover by colours gradient and 2-3 most popular products by percentage within these regions.

I pick my Redbubble sales history to be the data set because it can be displaying by various dimensions. Regions is display by map and presents the sales ranking by colour gradient. Donut pie chart present the product ranking and play as a decorative frame in the image.
